Cluster Framework
The basic premise of Zeek clusterization is to break down network traffic into smaller pieces, while preserving the affinity of individual network sessions to a single analysis process. Cluster architecture thus allows Zeek to distribute that analysis across many dozens or hundreds of worker processes, allowing the monitoring system to scale up to line speeds of 100G or more.
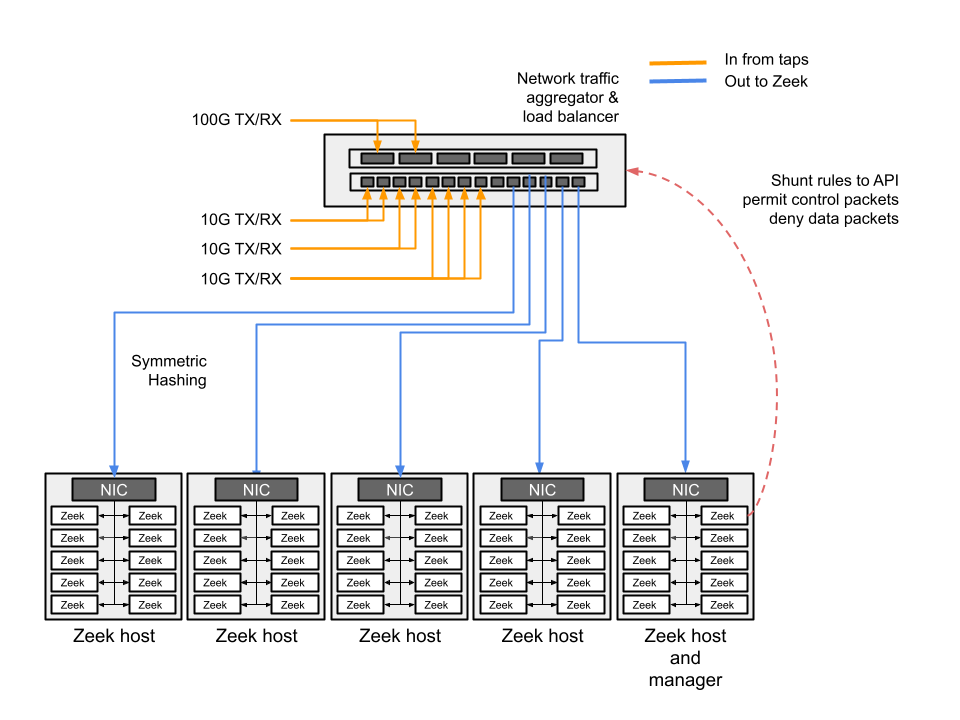
Figure 1: Block diagram of cluster setup showing multiple network feeds to a traffic aggregator. This device sends traffic to workers after symmetric hashing/load-balancing. Traffic is then fed to the Zeek cluster using load-balancing network cards.
Zeek’s Cluster Components
By distributing network traffic across hosts and processes, overall traffic finally reaches a volume that can be effectively analyzed by a single worker process. Zeek then acts as a distributed network security monitor to perform analysis across many dozens or hundreds of workers, all acting on a small fraction of the overall traffic volume. The analysis of the worker process is further facilitated by nodes such as manager and proxies, ultimately logging the alerts and or relevant network logs. A Zeek cluster therefore consists of four main components: a manager, workers, proxies, and a logger.
Manager
The manager is a Zeek process that has two primary jobs. It normally receives log messages and notices from the rest of the nodes in the cluster using the Zeek communications protocol. It combines the individual logs that each worker produces, so that the result is a set of joint logs instead of many discrete logs that you would have to combine in some manner with post-processing. (Note that if you use a separate logger node, then the logger receives all logs instead of the manager.) The manager also supports other functionality and analysis which requires a centralized, global view of events or data.
Worker
The worker is the Zeek process that sniffs network traffic and does protocol analysis on the reassembled traffic streams. Most of the work of an active cluster takes place on the workers. Workers typically represent the bulk of the Zeek processes that are running in a cluster. The fastest memory and CPU core speed you can afford is recommended since all of the protocol parsing and most analysis will take place here. There are no particular requirements for the disks in workers since almost all logging is done remotely to the manager (or dedicated logger). Normally, very little is written to disk.
Proxy
A proxy is a Zeek process that may be used to offload data storage or any arbitrary workload. A cluster may contain multiple proxy nodes. The default scripts that come with Zeek make only minimal use of proxies, so a single one will usually be sufficient. But custom scripts may make more use of it to partition data or workloads, providing greater cluster scalability potential than just doing similar tasks on a single, centralized manager node.
Zeek processes acting as proxies don’t tend to be extremely hard on CPU or memory, and users frequently run proxy processes on the same physical host as the manager.
Logger
A logger is an optional Zeek process that receives log messages from the rest of the nodes in the cluster using the Zeek communications protocol. The purpose of having a logger to receive logs instead of the manager is to reduce the load on the manager. If no logger is needed, then the manager will receive logs instead.
Running a Zeek Cluster
General Usage and Deployment
The biggest advantage to using a Zeek cluster is that most of its inner workings are transparent to the user. Clusterization is a clever trick to divide-and-conquer ever increasing network traffic volume.
As a practitioner one must know how to set up a cluster by defining components
such as the manager, proxies, loggers and workers in the
<prefix>/etc/node.cfg file on the manager.
Edit the ZeekControl node configuration file, <prefix>/etc/node.cfg,
to define where the logger, manager, proxies, and workers will run. For a
cluster configuration, comment-out (or remove) the standalone node in that
file, and either uncomment or add node entries for each node in your cluster
(logger, manager, proxy, and workers).
For example, to run five Zeek nodes (two workers, one proxy, a logger, and a manager) on a cluster consisting of three machines, the cluster configuration would look like this:
[logger]
type=logger
host=10.0.0.10

[manager]
type=manager
host=10.0.0.10

[proxy-1]
type=proxy
host=10.0.0.10

[worker-1]
type=worker
host=10.0.0.11
interface=eth0

[worker-2]
type=worker
host=10.0.0.12
interface=eth0
To set up a cluster we need a network-aggregator/load balancing device which can aggregate inputs from network sources, such as taps or span ports. This device also performs the critical function of ensuring each TCP session is distributed to a single link. This function is provided through symmetric hashing.
Once the tap aggregator is set, output from each port is sent to a “Zeek node” which is typically built on commodity hardware. Zeek clusters have evolved from running the manager, workers and proxies on individual servers, to most often now running a “cluster-in-a-box” setup, where a powerful multi-core box with dedicated cores hosts the workers, proxies logger and manager. We’ve seen instances of 90 workers running on a single physical server.
At present the preferred way to run a cluster is to use a load-balancing network card such as Myricom NICs or Intel cards with PF_RING or AF_PACKET support. The NIC (and associated software) further divides the traffic to multiple Zeek worker processes running on the ‘Zeek- node’.
While the Zeek cluster allows us to monitor traffic at scale, an optional add-on technology called “shunting” is helpful to reduce the volume that needs be processed.. Shunting can detect specific large data flows based on predetermined characteristics and communicate with the network tap via an API to stop sending those flows to Zeek for analysis. This allows Zeek to maintain awareness and logs of these shunted large flows while dramatically reducing the analysis load necessary to process traffic.
The following links gives more specific information on how to set up clusterization using one of the above approaches: Cluster Configuration.
Developing Scripts/Heuristics
This section is for developers who are interested in writing packages/scripts/heuristics and want to take advantage of clusterization.
In order to make your scripts/packages “clusterized,” one must understand the purpose of each of the cluster components (manager, workers, proxies and logger) and how/where the data is generated and how to move data/information across the different nodes in the cluster.
Workers: Workers are a good first choice for doing the brunt of any work. They should be spending a lot of time parsing or analyzing incoming data from packets. You might choose them to do a “first pass” analysis and then decide how the results should be shared with other nodes in the cluster.
Proxies: Proxies serve as intermediaries for data storage and computation offloading. Proxies help offload work or data in a scalable and distributed way. Since any given worker is connected to all proxies and can agree on an “arbitrary key -> proxy node” mapping (discussed later), you can partition work or data amongst them in a uniform manner. You might choose to use proxies as a method to share non-persistent state or as a “second pass” analysis for any work that you don’t want interfering with the workers’ capacity to keep up with capturing and parsing packets. The default scripts that come with Zeek make minimal use of proxies. If you are migrating from a previous ZeekControl deployment, you may want to implement a single proxy node. If you have custom or community scripts that utilize proxies, considering scaling up the number of proxies to meet demand.
Manager: A manager will make decisions that require a global view, as it is in a centralized location and connected to everything. However, that connectivity also makes it easy to overload it. Try to use a manager sparingly and only for tasks that must be done in a centralized or authoritative location. Optionally, for some deployments, the manager can also serve as the sole logger.
Loggers: Loggers should simply write logs to disk. In the default cluster configuration, log content gets distributed among available loggers in a round-robin fashion, providing failover capability should any given logger temporarily go offline.
The Need to Move Data and Events Across Different Nodes
Imagine you have a list of IP addresses that you want to distribute across all workers to keep in a watch list, such as the Intel framework. You may also want to aggregate results across workers to see if that count crosses a threshold, such as using scan detection. Finally, you might want to extract URLs from emails and then redistribute the extracted URLs to all workers to be able to find which of these extracted URLs got clicked on. All these examples tend to introduce challenges in a Zeek cluster setup due to data centrality issues. In other words, the very advantageous divide-and-conquer approach of clusterization also introduces complexity in Zeek scripts. However, with the introduction of the Broker communication framework and additional helper functions, data centrality complexities can be addressed efficiently. One must rely on clusterization techniques provided by Zeek scripting, the Broker API, and clusterization components.
When clustering your scripts, the fundamental work to move data or events in the context of a cluster falls primarily on few high level abstractions of communication patterns:
Manager-to-worker
Worker-to-manager
Worker-to-proxy
Worker-to-manager-to-worker
Manager-to-worker-to-manager
All the communication between workers, proxies and manager is established by Zeek via the Broker framework. The Broker framework provides basic facilities for connecting Zeek instances to each other and exchanging messages, events or data.
Cluster Topics
All Broker-based messaging involves two components: the information you want to send, such as an event with its arguments, along with an associated topic name string. The topic strings are used as a filtering mechanism: Broker uses a publish-subscribe communication pattern where peers advertise interest in topic prefixes and only receive messages which match one of their prefix subscriptions. Broker itself supports arbitrary topic strings. However, Zeek generally follows certain conventions in choosing these topics to help avoid conflicts and generally make them easier to remember.
To communicate between workers, proxies and manager one needs to know the topic name to which all workers, proxies and manager are subscribed. Two main topics that are important to be familiar with for cluster communication are:
Cluster::worker_topic- to which all workers are subscribed
Cluster::manager_topic- to which manager is subscribed
In addition to these, Cluster::proxy_pool (comprises all the
proxies) is a useful set.
The following table illustrates all the topics and communication events for clusterization, along with potential use cases:
Event |
Topic |
Use cases |
|---|---|---|
Manager to worker |
|
|
Worker to manager |
|
|
Workers to proxy |
|
|
Worker to manager to worker |
|
|
Manager to worker to manager |
|
Publishing Events Across the Cluster
Broker, as well as Zeek’s higher-level cluster framework, provide a set of function to publish events, including:
Function |
Description |
Use |
|---|---|---|
Publishes an event at a given topic |
Standard function to send an event to all nodes subscribed to a given topic |
|
Automatically send an otherwise generated Zeek event to any interested peers whenever it is locally dispatched. |
Avoid, since it is somewhat “magical”, unless you’ve got code
compartmentalization running with |
|
Publishes an event to a node within a pool according to Highest Random Weight (HRW) hashing strategy; see details below |
Use this in cases of any aggregation needs - eg. scan detection or anything that needs a counter going. |
|
Publishes an event to a node within a pool according to Round-Robin distribution strategy. |
Generally used inside Zeek for multiple logger nodes. |
An example sending an event from worker to manager:
event worker_to_manager(worker_name: string)
    {
    print "got event from worker", worker_name;
    }

event some_event_handled_on_worker()
    {
    Broker::publish(Cluster::manager_topic, worker_to_manager,
                    Cluster::node);
    }
More details and code snippets and documentation on Broker communication frameworks are available at Broker Communication Framework.
Distributing Events Uniformly Across Proxies
If you want to offload some data/work from a worker to your proxies, we can
make use of a Highest Random Weight (HRW) hashing distribution strategy to
uniformly map an arbitrary key space across all available proxies through
Cluster::publish_hrw. This function publishes an event to one node
within a pool according to a Highest Random Weight hashing strategy. By
assigning Cluster::proxy_pool to this event, one can utilize
proxies to handle it. Note that Cluster::publish_hrw requires a
unique key as an input to the hashing function to uniformly distribute keys
among available nodes. Often this key is a source or destination IP address. If
you are using Cluster::publish_hrw for an aggregate function, such
as counts unique across the workers, make sure to appropriately select the
hashing key.
The following example illustrates this issue. Assume that we are counting the
number of scanner IPs from each /24 subnet. If the key were the source IP,
then depending on the hashing, different IP addresses from the same /24
might end up on different proxies for the aggregation function. In this case
one might instead want to use a more inclusive hashing key, such as the subnet
(/24) itself. To illustrate the issue, in the notice log below, you see
that 3 scanners each from 52.100.165.0/24 went to proxy-1 and
proxy-2. Ideally we want a single count of 6 scanners instead.
1600212249.061779             Scan::Subnet  52.100.165.0/24 has 3 spf IPs originating from it 52.100.165.249  52.100.165.237  52.100.165.246  -       52.100.165.246  -       -             proxy-2 Notice::ACTION_LOG      3600.000000          F

1600212293.581745       Scan::Subnet        52.100.165.0/24 has 3 spf IPs originating from it 52.100.165.247  52.100.165.244  52.100.165.205        -       52.100.165.205  -       -       proxy-1 Notice::ACTION_LOG      3600.000000
Instead, we can ensure the hash key is 52.100.165.0/24 instead of the
original IP, as the hash for 52.100.165.0/24 will be the same for all
addresses belonging to this subnet. Then the data will reach only one proxy.
To that end, we can use the mask_address function to extract subnet
information for a given IP address to use as a key in the hash function:
local spf = mask_address(orig);

@if ( Cluster::is_enabled())
    Cluster::publish_hrw(Cluster::proxy_pool, spf, smtpsink::aggregate_stats, c) ;
@else
    event smtpsink::aggregate_stats(c);
@endif
Carefully select the key for Cluster::publish_hrw. If done right,
this feature will bring tremendous benefits in code scalability, especially
when working with aggregate and threshold functions.
Note
In scripting for clusterization, using the correct module names and namespaces is crucial as both events and data are transmitted to different systems. In order to make sure the contexts are correct, all functions, events and datasets should be scoped within their respective namespaces and modules. An easy rule of thumb is to always use the explicit module namespace scoping. See A Reminder About Events and Module Namespaces for further explanation and examples.
Clusterization of Zeek scripts can be an intimidating task for beginners. However, with reliance on the new Broker framework, clusterization has become simpler and straightforward. Consider the following:
Communication overhead: Be sure not to generate unnecessary communication overhead. For example, scan detection is one of the worst cases for distributed analysis. One needs to count connections from a given IP address across all workers and then aggregate them on a proxy or manager. All the connections have to reach an aggregate function before Zeek can determine if a given source is a scanner or not. This happens because each worker only has a limited picture of the activity generated by a given remote IP.
Communication optimizations: Once a given remote IP is identified as desired, make sure a manager reports that to the worker, and workers stop sending any further data for that IP to the manager. This is especially useful in scan detection where it takes only a few connections to identify scans, while a given scanner might send millions of probes eventually. If done right, workers will only send the first N connections, and stop after that, thus saving a lot of communication overheads. However, it makes sense to stop workers from sending any further connection information
Clusterization also requires timely state synchronization across the workers, to make sure that all workers have a common view of a particular heuristic.
When writing scripts for clusterization make sure your detection runs in both cluster and standalone setup.
A Cluster Script Walkthrough
Let’s say we want to count how many connections a remote IP is making to a host in our network on port 3389 UDP. Due to the distributed nature of Zeek clusters, connections are distributed across the workers based on a 5-tuple hash (source IP, source port, destination IP, destination port, and protocol). To get a central view of a connection between a given IP pair, one must deploy a clusterized scripting approach. The following example highlights how to go about doing so.
In this use case, we intend to create an aggregation function.
Cluster::publish_hrw appears to be the appropriate function, since
it allows offloading a lot of work to proxies, thus leaving workers and manager
to process traffic.
In order to make sure all the connections between two hosts go to a single
specific proxy, we need to make sure the key for the hashing function
accommodates this constraint. We will use orig_h+resp_h as the key. We
create a new data-type called pair as seen in code below. This allows us
to use the orig+resp as a unique key across the code, including in the
candidate table. Further, we create a new data type called stats to keep
track of additional data associated with a connection pair.
module DoS;

export {

    redef enum Notice::Type += {
        Threshold,
        Victim_3389UDP,
    };

    type pair: record {
          orig: addr;
          resp: addr;
    };

    type stats: record {
        orig: addr;
        resp: addr ;
        orig_bytes: count &default=0;
        resp_bytes: count &default=0;
        conns: count &default=0;
    };

    global dos_candidates: table [pair] of stats  &create_expire=1 day;

    global DoS::aggregate_stats:event(s: stats);
}
We choose the connection_state_remove event as the primary event to
tap into. connection_state_remove is generated when a connection’s
internal state is about to be removed from memory. It’s appropriate for this
case, as all the information about the connection is now included in the
connection record c. One disadvantage of using
connection_state_remove is that the event is fired at the very end
of the connection, after the expiration timeouts are over. Thus, there are
delays, and any operation which happens on the data is “after-the-fact” that
connection is over. While this could be a problem in approaches such as
proactive blocking and early detection heuristics, in this case of aggregation
it is not an issue.
The thing to pay attention to in the code snippet below is the
@if-@else-@endif directives which
differentiate between clusterized and standalone operation of the script. With
the @if construct, the specified expression must evaluate to type
bool. If the value is true, then the following script lines (up to the next
@else or @endif) are available to be executed. In this
case we check if Cluster::is_enabled. If so, we call
Cluster::publish_hrw along with the key (hash_pair) and the
aggregate function followed by parameters, which is the stats record in this
case. If the cluster isn’t running that aggregate function, it is directly
called.
event connection_state_remove(c: connection)
    {
    local service = c$id$resp_p;
    local resp = c$id$resp_h;

    if ( service != 3389/udp )
        return;

    if ( resp !in Site::local_nets )
        return;

    local s: stats;
    s$orig = c$id$orig_h;
    s$resp = c$id$resp_h;
    s$orig_bytes = c$conn$orig_ip_bytes;
    s$resp_bytes = c$conn$resp_ip_bytes;

    local hash_pair: pair;
    hash_pair$orig = c$id$orig_h;
    hash_pair$resp = resp;

    @if ( Cluster::is_enabled() )
        Cluster::publish_hrw(Cluster::proxy_pool, hash_pair, DoS::aggregate_stats, s);
    @else
        event DoS::aggregate_stats(s);
    @endif
    }
Since hash_pair makes the key unique, irrespective of what worker this
specific connection has gone to, it will end up on a one specific proxy only.
event DoS::aggregate_stats(s: stats)
    {
    local p: pair ;
    p$orig = s$orig;
    p$resp = s$resp ;

    if ( p !in dos_candidates )
        {
        local tmp_s: stats;
        tmp_s$orig = s$orig;
        tmp_s$resp = s$resp;
        tmp_s$orig_bytes = 0;
        tmp_s$resp_bytes= 0;
        tmp_s$conns = 0;

        dos_candidates[p] = tmp_s;
        }

    dos_candidates[p]$conns += 1;
    dos_candidates[p]$orig_bytes += s$orig_bytes;
    dos_candidates[p]$resp_bytes += s$resp_bytes;

    local n = dos_candidates[p]$conns;

    local thresh = check_ip_threshold(dos_threshold, ip_pair_threshold_idx, p, n);

    if ( thresh )
        {
        local msg = fmt("%s pair has reached %s threshold %s",
                        p, n, dos_candidates[p]);
        NOTICE([$note=DoS::Threshold, $src=p$orig, $msg=msg]);

        if ( dos_candidates[p]$resp_bytes > 0 )
            NOTICE([$note=DoS::Victim, $src=p$orig, $msg=msg,
                   $identifier=cat(p$resp), $suppress_for=1 hrs]);
        }
    }
Conclusion
We hope that this guide will help you take advantage of Zeek’s cluster capabilities in your deployment.